

Erythroblastic islands (EBIs) are specific structures in the bone marrow, including central macrophages, that are surrounded by red blood cell precursors at different stages of terminal differentiation. But it has never been found to have function in tumors. Hepatoblastoma (HB) is the most common malignant liver tumor in pediatrics and requires more effective and safe treatment methods to prevent disease progression and the lifelong impact of complications on young children. However, the development of such therapies is hindered by a lack of comprehensive understanding of the tumor microenvironment.

On May 16, 2023, the Precision Medicine Research and Pediatric Surgery Department of the First Affiliated Hospital of Sun Yat sen University jointly published a research paper titled "Intratumoral Erythroblast Islands Stress Anti tumor Immunity in Hepatoblastoma" in Cell Reports Medicine. This study provides a single cell map of hepatitis B immune microenvironment and determines the role of EBI in tumor immune microenvironment regulating immunosuppression.
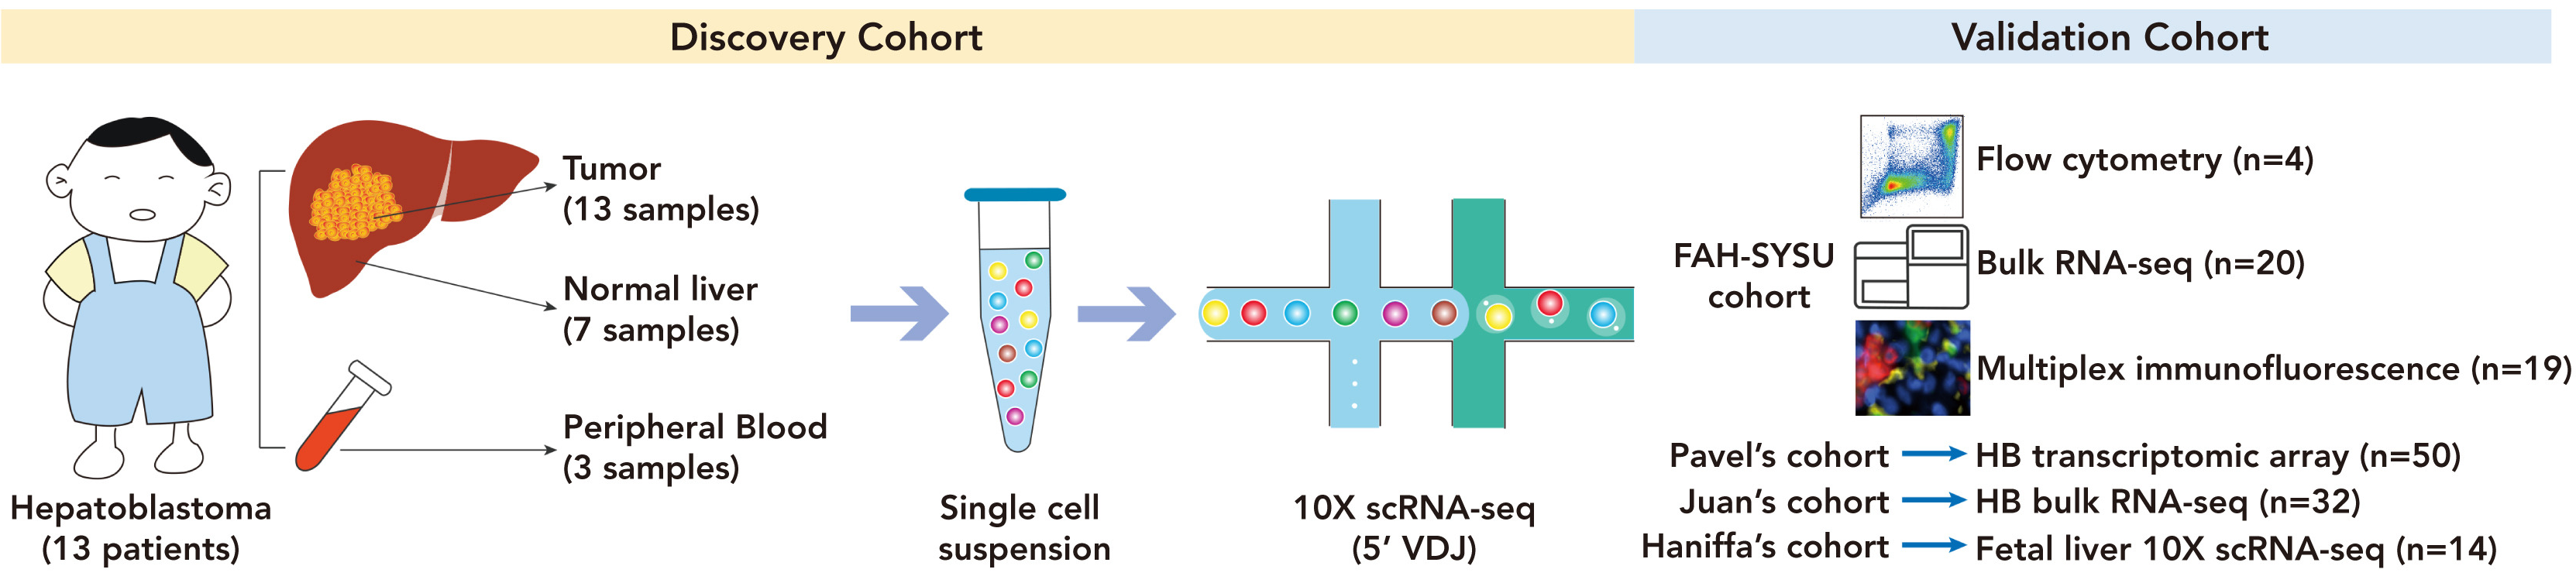
Through single-cell RNA sequencing of 13 untreated HB patients, we identified an immune feature of abnormal accumulation of EBIs formed by VCAM1+macrophages and red blood cells, which is negatively correlated with the survival rate of HB. Red blood cells inhibit the function of dendritic cells (DCs) through the LGALS9/TIM3 axis, leading to impaired anti-tumor T cell immune response. However, TIM3 blockade alleviated the inhibitory effect of red blood cells on DCs. This study provides an immune escape mechanism mediated by EBIs within tumors and proposes TIM3 as a promising therapeutic target for HB. The results may help to develop safer and more effective immunotherapy for children with hepatitis B.
Experimental part
1 This article uses the TissueFAXS Spectra panoramic multispectral tissue scanning quantitative analysis system from TissueGenomics to collect multi-color fluorescence images of HB tissue samples. Using a spectral library for spectral splitting to obtain a single channel fluorescence signal. DAPI channel recognizes single cells. Set the distance radius based on the staining status of each protein, with the nucleus as the center, to obtain the fluorescence staining signal of each protein. Then, based on the staining status of each channel, a threshold is set to divide the positive cell population and count the positive cells.
2 Perform spatial co localization analysis on data using Tissue Cytometry technology. Calculate the distance between cells of interest and the number of neighbors between each pair of cell phenotypes (maximum distance of 25 mm). To regulate the density of red blood cells, we calculated the density of TIM3+DCs around LGALS9+red blood cells within a radius of 25 mm, and then divided by the density of LGALS9+red blood cells within the tumor. Thus, the number of TIM3+DCs near each LGALS9+erythroid cell can be obtained.
3 Flow Cytometry technology focuses on precise quantitative analysis of individual cells in fluid flow, but cannot obtain in situ cell morphology and distribution relationships of tissues; The Tissue Cytometry technology is based on the principle of panoramic multispectral imaging, which can obtain in situ single-cell quantitative analysis of tissues. At the same time, it can not only analyze the accuracy of the target at the subcellular level such as nucleus/cytoplasm, but also quantitatively analyze the position and role of the target in real organisms through its spatial distribution relationship with tumors.
The author of this article jointly used Flow Cytometry technology and Tissue Cytometry technology to compare the cell number and fluorescence intensity of target red blood cells in vitro/in vivo. Especially in the Tissue Cytometry technology, TME in situ spatial phenotype analysis data was obtained. Combined with TSA multiplex immunofluorescence technology, the spatial interaction relationship between LGALS9+red blood cells and TIM3+DCs was explored, and an immune environment characterized by abnormal accumulation of EBI was discovered, laying a solid foundation for further experiments in the future.
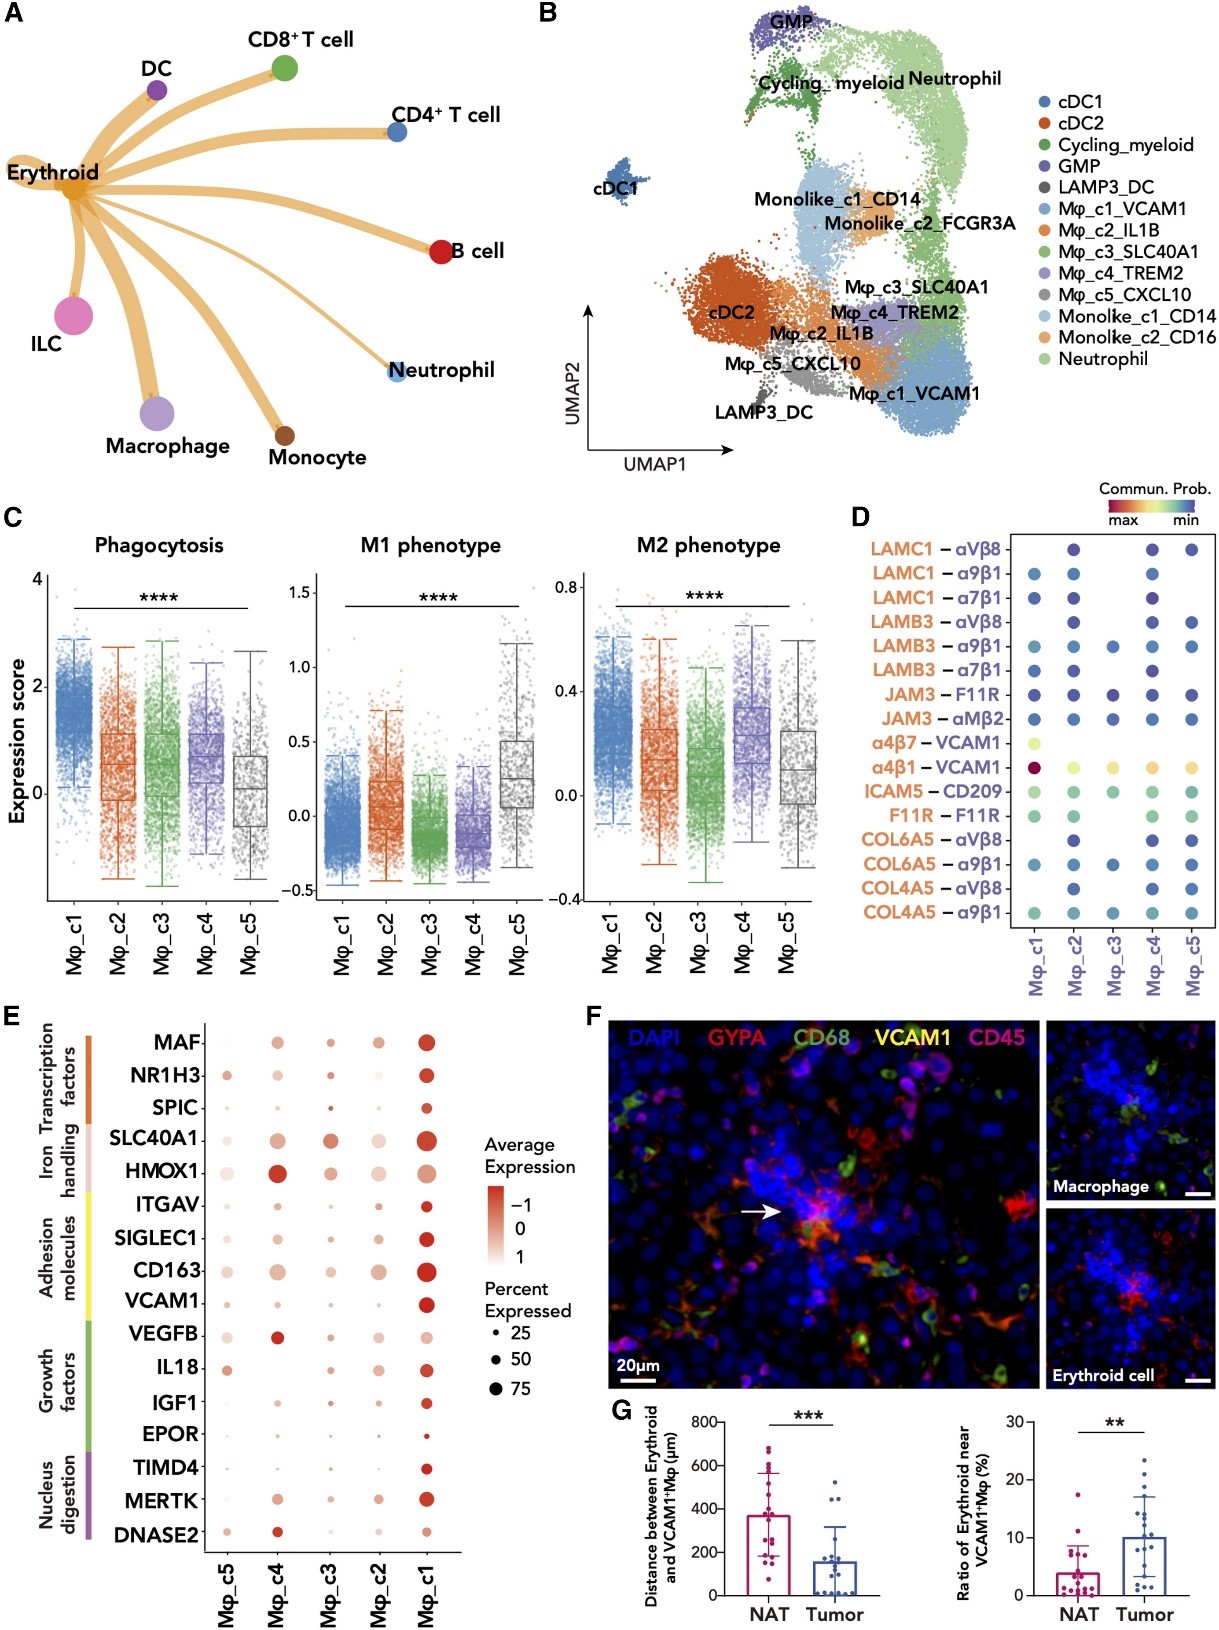
Fig 1 VCAM1+macrophages form EBIs with red blood cells
(F) In the multiple immunofluorescence image of hepatitis B tumor, the arrow points to the EBI structure, which is composed of CD68+VCAM1+macrophages and surrounding CD45 Gypa+erythroid cells.
(G) The distance between red blood cells and VCAM1+macrophages in HB tumor and adjacent liver samples (left) and the ratio of red blood cells to VCAM1+macrophages (≤ 25 μ m).
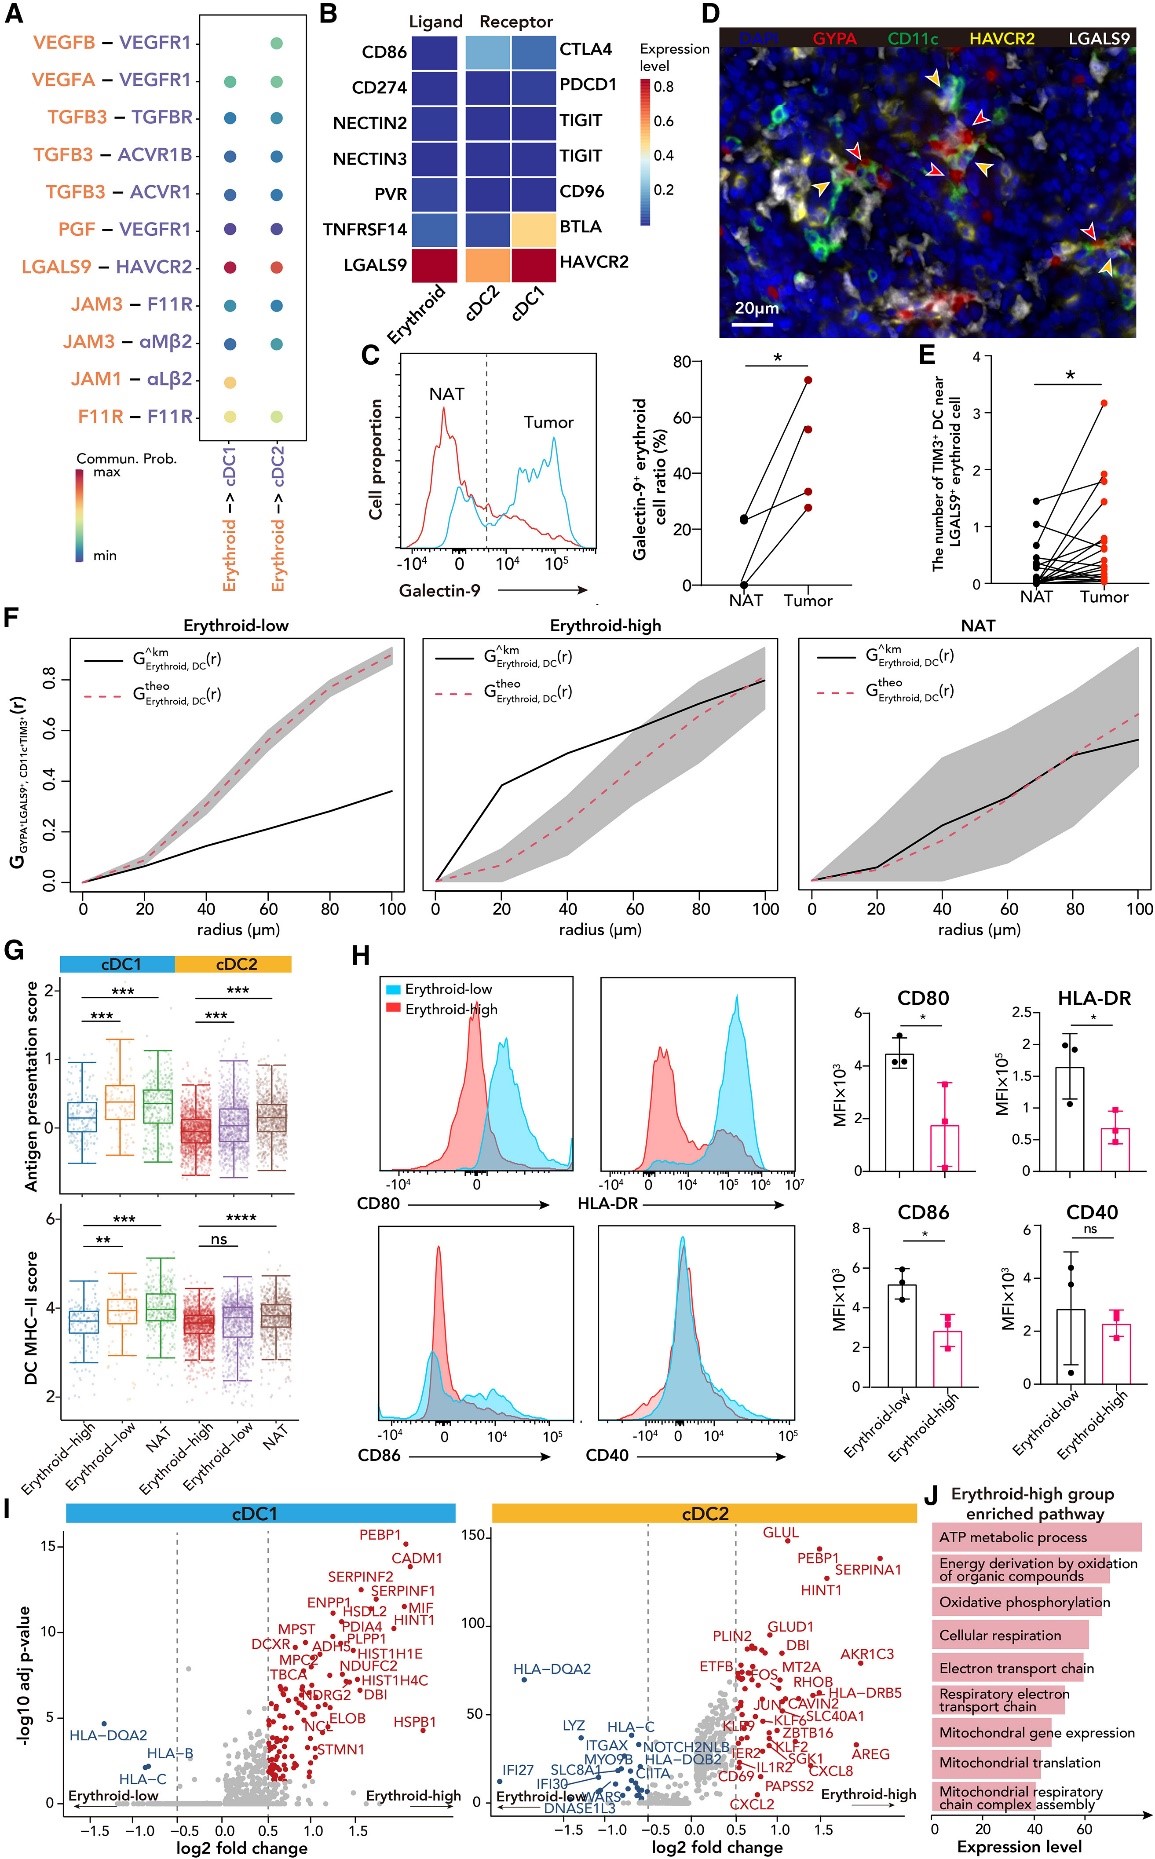
Fig 2 Tumor associated red blood cells inhibit the anti-tumor function of DCs through the LGALS9/TIM3 axis
(D) The multi-color immunofluorescence staining image of HB tumor shows the interaction between red blood cells (LGALS9+Gypa+, marked with red arrows) and DCs (CD11c+TIM3+, marked with orange arrows).
