

Bladder cancer (BLCA) is one of the most common cancers in the world, with 573278 new cases and 212536 new deaths in 2020. Despite radical cystectomy and platinum chemotherapy, advanced bladder cancer, including locally advanced and metastatic bladder cancer, is generally regarded as an incurable disease with poor prognosis. Immunotherapy is a treatment method that uses drugs to stimulate the immune system to fight cancer. Immune checkpoint blockade (ICB) is one of the methods of immunotherapy that targets molecules that prevent immune cells from attacking cancer cells. Although immunocheckpoint block (ICB) therapy has been approved for bladder cancer (BLCA), only a few patients respond to these treatments, so it is urgent to explore combined therapy.
On July 6, 2023, Professor Zu Xiongbing's team from the Department of Urology at Xiangya Hospital of Central South University published a research paper titled "S100A5 Incentives Efficiency of Anti-PD-L1/PD-1 Immunotherapy by Inhibiting CD8+T Cell Mediated Anti Cancer Immunity in Blade Cancer" in Advanced Science. This article provides new insights into the molecular mechanisms of immune escape and drug resistance in bladder cancer, and proposes a potential strategy to improve the efficacy of immunotherapy for this disease.
S100A5 is an oncogene that promotes tumor growth and invasion. Multi omics analysis revealed that S100A5 is a novel immunosuppressive target of BLCA. The expression of S100A5 in malignant cells inhibits the recruitment of CD8+T cells by reducing the secretion of pro-inflammatory chemokines. In addition, S100A5 also reduces the killing of cancer cells by effector T cells by inhibiting the proliferation and cytotoxicity of CD8+T cells. In addition, S100A5, as an oncogene, promotes tumor proliferation and invasion. Targeting S100A5 can enhance the efficacy of anti-PD-1 therapy by increasing the infiltration and cytotoxicity of CD8+T cells. In clinical practice, there is a spatial mutual exclusion relationship between S100A5+tumor cells and CD8+T cells in tissue chips. Moreover, S100A5 is negatively correlated with the efficacy of immunotherapy in both applied and conventional immunotherapy cohorts.
In summary, S100A5 inhibits the secretion of pro-inflammatory chemokines and recruitment and cytotoxicity of CD8+T cells, creating a non inflammatory tumor microenvironment in BLCA. Targeting S100A5 can transform cold tumors into hot tumors, thereby enhancing the efficacy of ICB therapy in BLCA.
Experimental part
This article uses the TissueFAXS Spectra panoramic multispectral tissue scanning quantitative analysis system from TissueGenomics to collect multi-color immunofluorescence images of TMA samples from 50 BLCA specimens.
Panel 1 : S100A5,CK19,CD8,CD4
Panel 2:S100A5,CK19,CD16,CD68
In order to identify a biomarker that can not only predict the infiltration of tumor infiltrating immune cells (TIICs) for diagnosis, but also develop a new anti-PD-1/PD-L1 combination therapy strategy, the author used in situ multi-color immunofluorescence staining and precise identification of cell phenotypes at the single-cell level through Tissue Cytometry technology. In addition, the spatial distribution analysis strategy of TMA chip in situ microenvironment was used to explore the interaction relationship between different phenotype cells and tumor tissues.
At the single-cell quantitative level, cells are first counted by identifying nuclear markers, and then the morphology of cytoplasm/membrane staining is accurately identified using the nuclear expansion algorithm of Tissue Cytometry. After obtaining the contour area of single-cell true staining, statistical analysis is performed on the pixel intensity of each cell protein marker to ultimately obtain the true intensity level of single-cell protein expression. This method is used for precise screening and division of positive thresholds, and even further identifies the functional relationship between positive cells and adjacent negative cells.
In terms of spatial distance analysis, considering the distribution characteristics of cells in the tumor microenvironment, the closer the distance to the tumor boundary, the more significant the relative effect. Therefore, the author of the article adopted four ranges of distance gradient 0-25 μ m, 25-50 μ m, 50-100 μ m, and 100-150 μ m after considering the analysis of the relationship between microenvironment effects. This not only refined the accuracy of tumor microenvironment research, but also took into account the data analysis of distant cells.
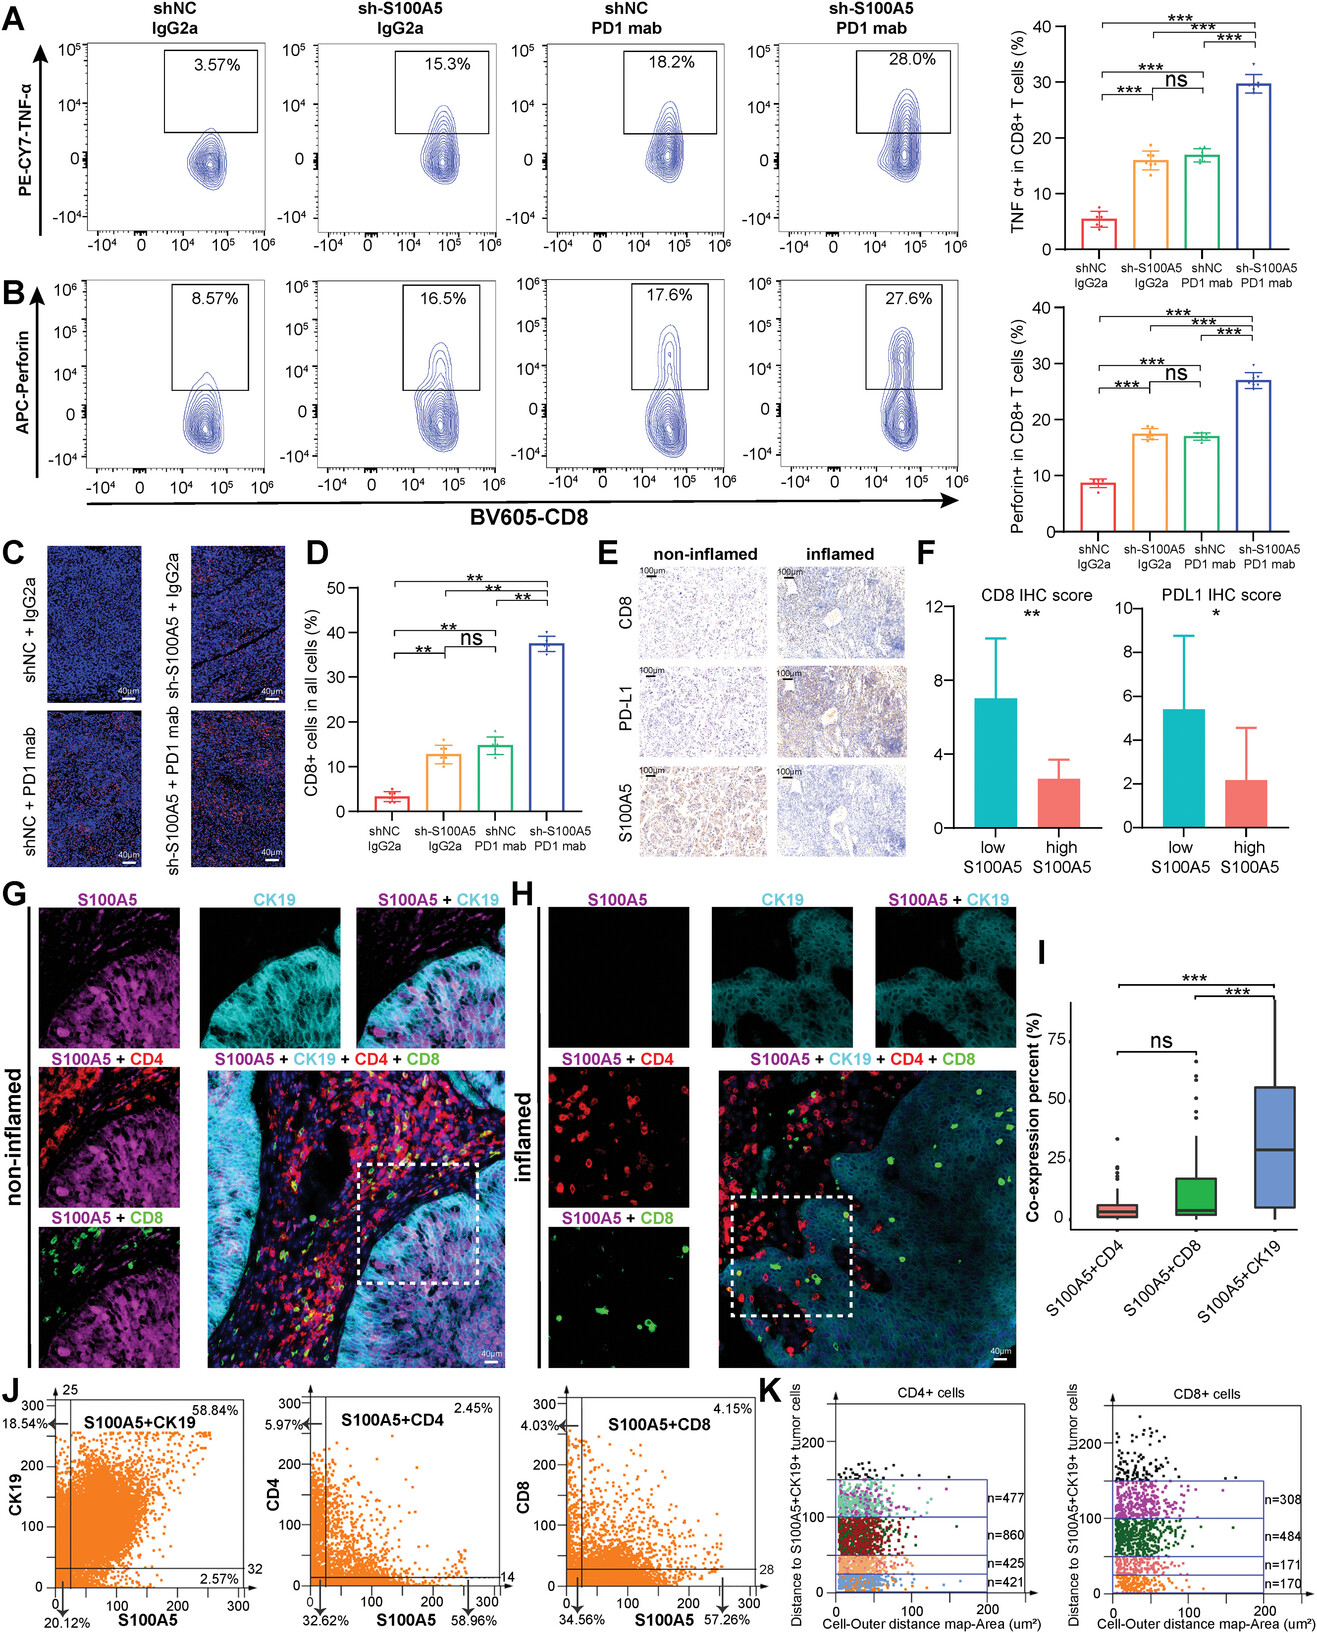
Figure 1 The quantitative analysis of mIHC panoramic tissue reveals the spatial distance relationship between S100A5 and effector T cells in TME
(C)Immunofluorescence images of CD8 staining between different experimental groups.
(D)The percentage of CD8+cells in all cells corresponding to the IF image.
(E)Immunohistochemical images display the expression results of CD8, PD-L1, and S100A5 in non inflammatory and inflammatory TME.
(G)Immunofluorescence images of S100A5 (purple), CK19 (sky blue), CD4 (red), CD8 (green), and DAPI (blue) in the inflammatory group (H).
(I)The proportion of S100A5+CD4+, S100A5+CD8+, and S100A5+CK19+cells in TMA varies. The class flow scatter plot displays the percentages of S100A5+CK19+, S100A5+CD4+, and S100A5+CD8+cells. The spatial distribution of CD4+and CD8+T cells within the distance gradient (0-25 μ m, 25-50 μ m, 50-100 μ m, 100-150 μ m) of S100A5+CK19+tumor cells.
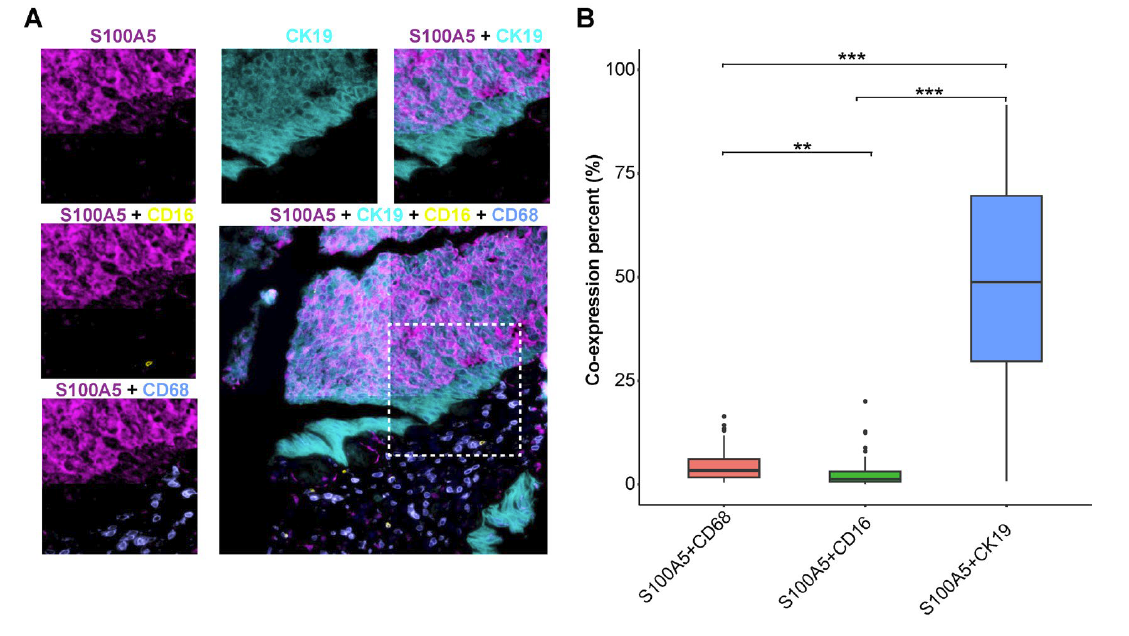
Figure 2 (A)S100A5 is co expressed on malignant cells, NK cells, and macrophages: S100A5 (purple), CK19 (sky blue), CD16 (yellow), CD68 (light blue). (B) Histogram of the proportion of S100A5+CD68+, S100A5+CD16+, and S100A5+CK19+cells in the entire TMA.
