MULTICHANNEL TISSUE CYTOMETRY

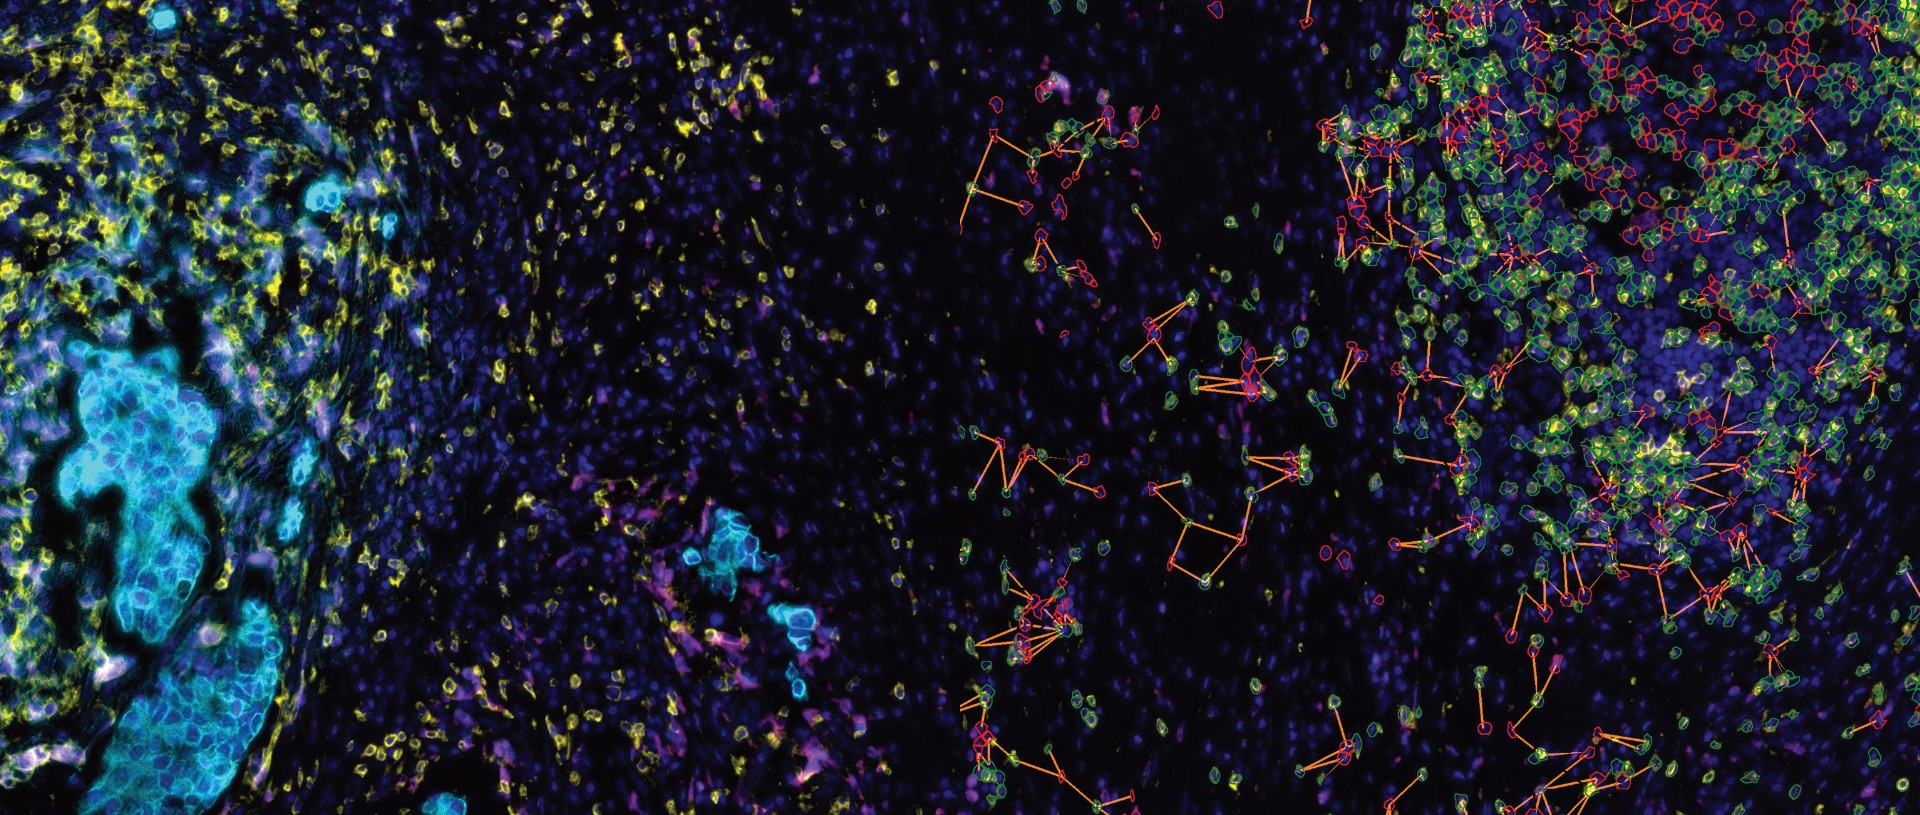
TissueQuest (TQ) is a software platform for the automatic identification and quantification of single cells in situ in tissues, which is used to solve the screening of specific staining signals on nucleus/plasmid/membrane of different types of cells in fluorescent samples. Based on the staining condition of the samples and the morphological characteristics of the cells, it can accurately analyse the differences in data between different experimental groups.

TQ adopts the streamlined operation mode of sample import + one-click analysis, and then adjusts the analysis parameters based on the results of quantitative data analysis by using the scatterplot forward and backward retrospective tool to adjust the analysis parameters according to the differences of the samples. This iterative data acquisition process, based on the powerful image computing capability of the software, obtains the big data information contained in the slices in real time, and guides the researcher to finally obtain the data results that reflect the actual situation of the samples.


KEY FEATURES

Nucleus recognition algorithm

Multiple cytoplasmic morphology recognition modes

In situ analysis of cellular phenotypes

Forward and reverse backtracking

FISH analysis

Multiple data presentation modes

Forward and reverse backtracking data validation
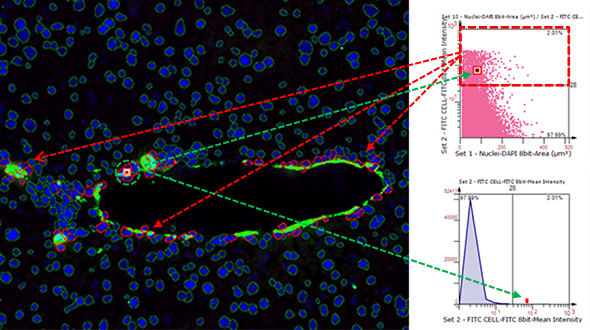
Tissue and cellular data analysis using the forward and reverse retrospective function, support from the image to the data of the positive analysis, but also support from the data results to the image of the reverse retrospective validation of the image and the analysis of the results of the close integration of the image to achieve the real-time linkage between the digital image, the scatterplot and the data of the three aspects. The validity of the data can be independently and repeatedly verified to accurately measure the results of tissue cell signal splitting and identification, to ensure the accuracy of sample identification, the threshold of positive rate division or the reliability of tracing the in situ information of positive signals in tissues, and to further help researchers to rapidly locate rare cell subpopulations, such as differentiated stem cells.
Multiple cytoplasmic morphology identification

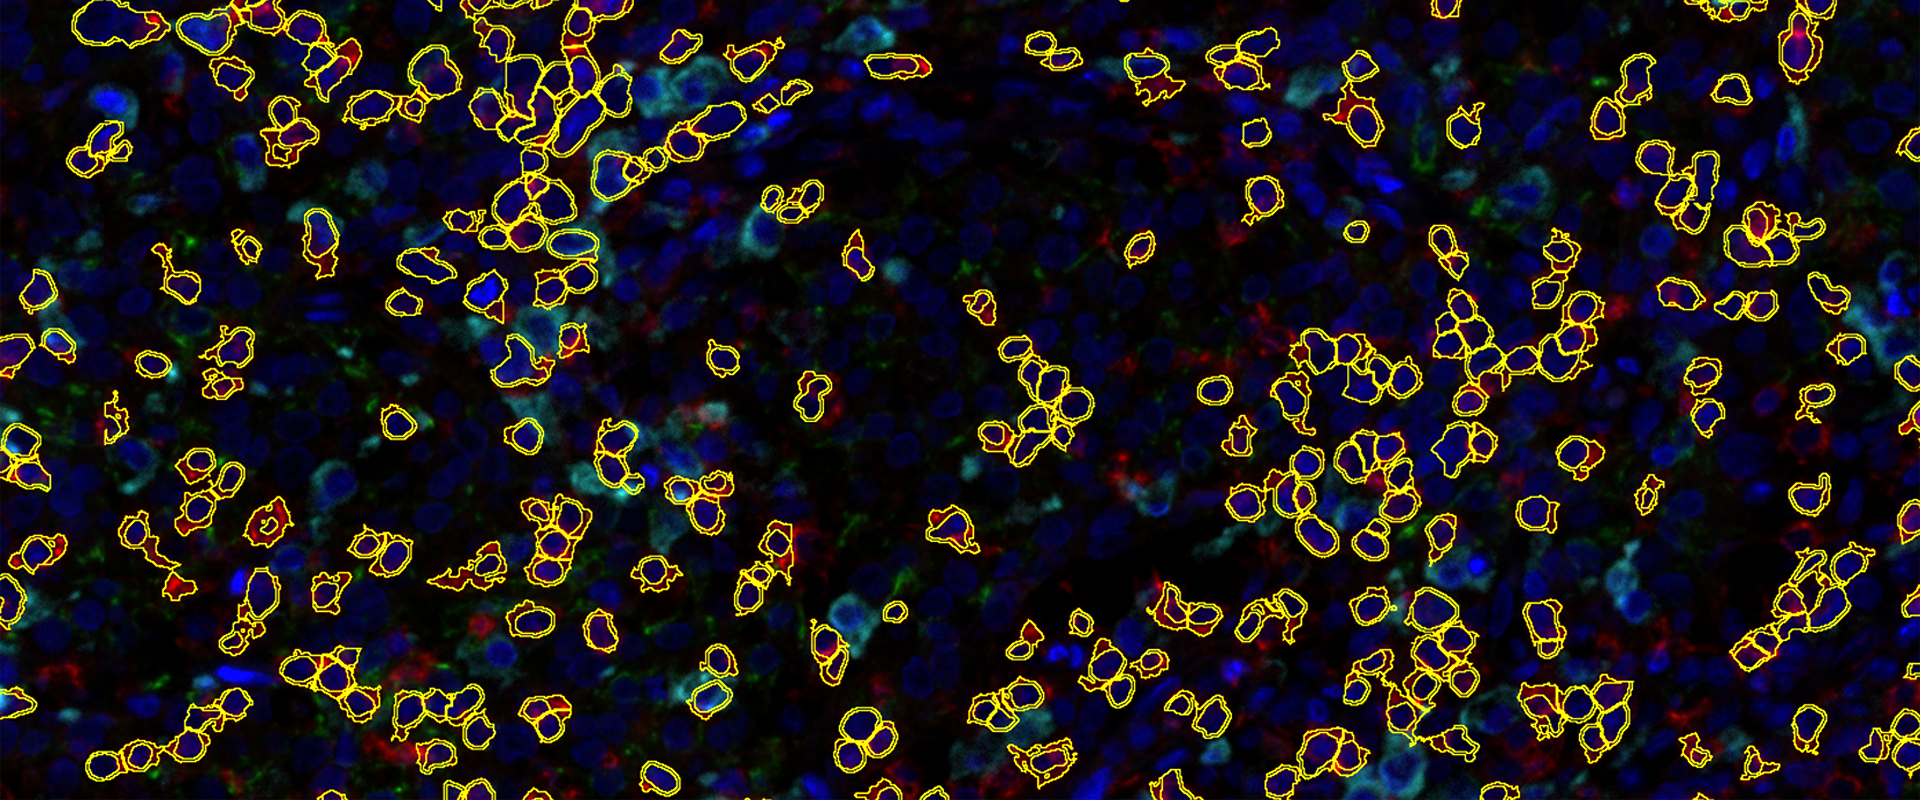
In the calculation process of cytoplasm identification, TG not only uses the common cell ellipse fitting algorithm (Ring Mask) on the market to calculate the fixed peripheral contour of cells, but also performs unique markers based on the true peripheral contour of cytoplasmic staining in the sample. Accurately identify (Growing Mask), and calculate the staining conditions and morphology-related parameters of multiple cells. The free combination of the two algorithms not only achieves the selection independence of the identification algorithm, but also achieves the accuracy of data authenticity for accurate identification of large-scale complex cell diversity.

Cell group circling statistics

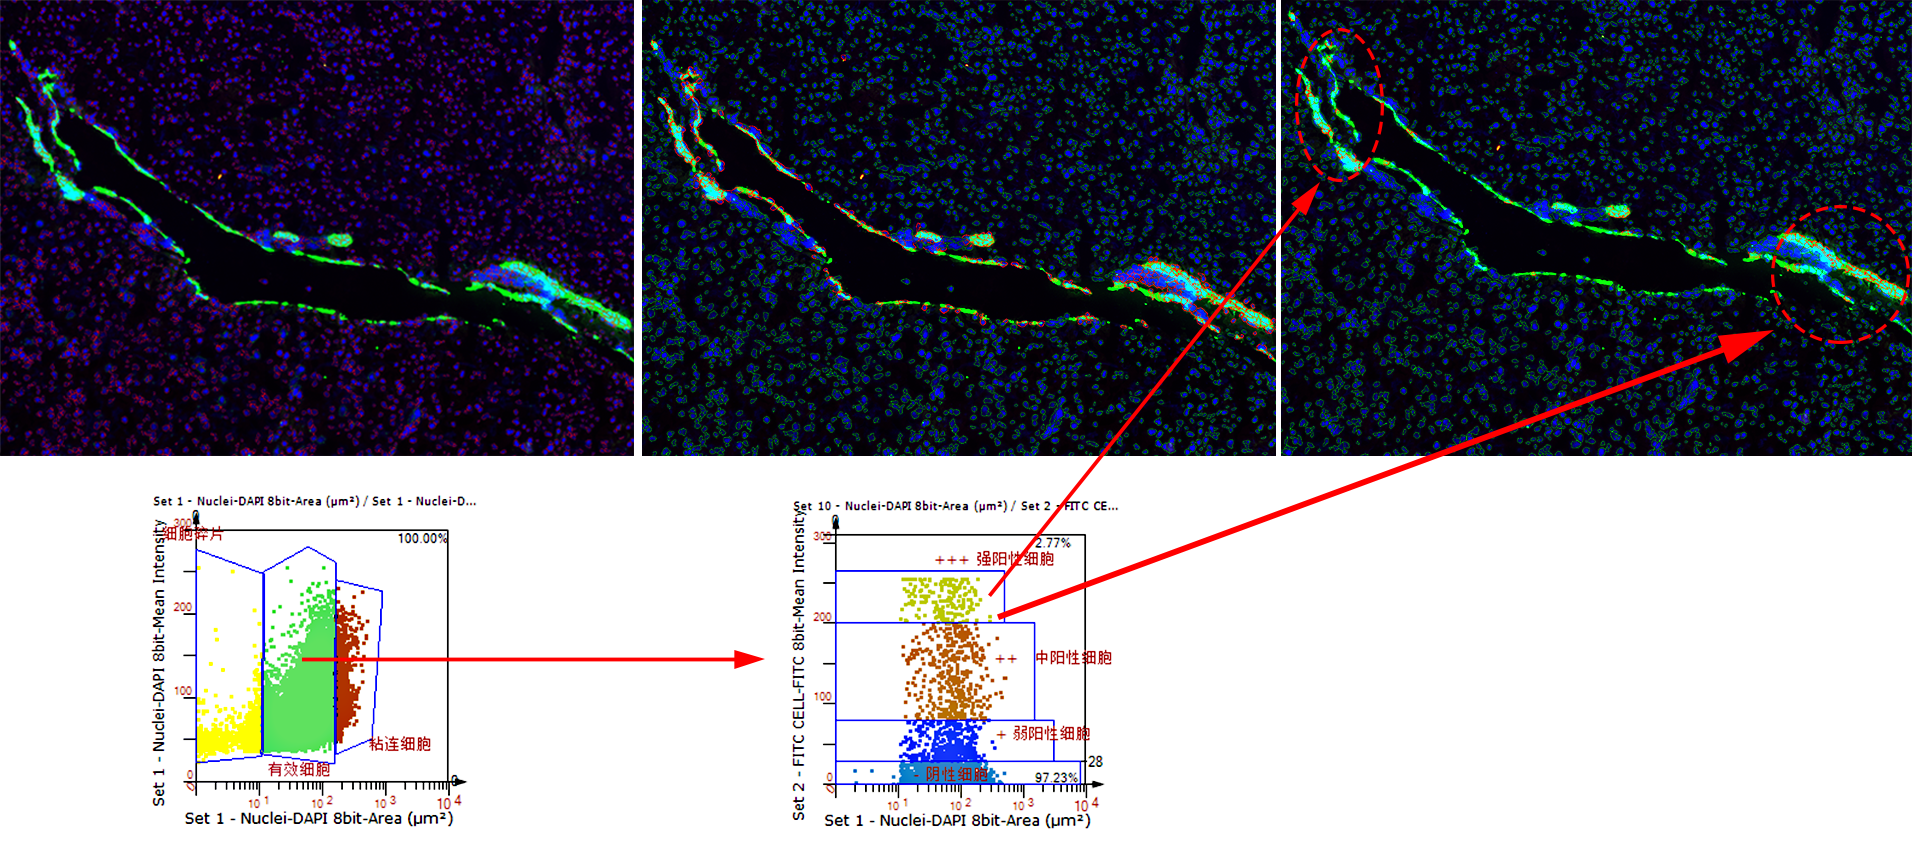
Tissue Cytometry gives multiple analysis parameters per cell, and with the Gate and Input Gate functions, allows the user to screen for specific subpopulations of cells of interest.

The Gate tool accurately screens for news, based on differences in nuclear size, staining intensity, and excludes adherent cells and cellular debris (left scatter plot). A new scatterplot is created to analyse only valid cells (right scatterplot), and the Gate can be used to further classify valid cells into groups of different marker expression intensities, making it simple to achieve accurate marker expression intensity statistics.


In situ co-expression analysis of cellular phenotypes

Co-expression analysis of cells has always been an important but very cumbersome step in immunofluorescence samples, especially the accurate analysis of multilabeled samples is a problem that we often face. Here TG simplifies the analysis steps and uses the analysis idea of setting up GATE gates in the flow scatterplot to screen cells, setting up gates layer by layer and real-time dimensionality reduction of cells in each channel of immunofluorescence samples, and finally obtaining information such as number and in-situ distribution of the target cells. The number of target cells and their in situ distribution are finally obtained, which is a streamlined and efficient analysis process, and then the reverse backtracking function is used to make the co-labelled target cell populations in the samples clear at a glance.