

Lymph nodes are secondary lymphoid organs that can induce adaptive immune responses through tight intercellular interactions. The structure of the germinal center in lymph nodes is where B cells and follicular helper CD4+T cells gather and promote antibody maturation. Undifferentiated T cells enter the medullary region of lymph nodes through CCR7 mediated chemotaxis and are then activated by antigen-presenting cells. Activated T cells can re-enter the lymphatic circulation through S1P mediated efflux mechanism, which is inhibited by CD69 on activated and LN resident cells. The CD8+T cells (fCD8) in the germinal center are associated with immune control against various viral infections and cancers. Although fCD8 is associated with immune control, the mechanism of action of these cells is not fully understood.

On May 19, 2023, Professor Bruce D. Walker, Director of the Ragon Institute at Massachusetts General Hospital, Harvard Medical School, published a research paper titled "Cytolytic CD8+T cell infiltration rate genomic centers to limit ongoing HIV replication in sporadic controller lymph nodes" in Science Immunology.
The article explores the function, clonal composition, spatial localization, phenotypic characteristics, and transcriptome profile of virus specific CD8+T cells in lymph nodes of individuals who control HIV infection without medication. The results showed that antigen induced proliferation and cytotoxicity potential consistently distinguished between spontaneously controlled and uncontrolled individuals. T cell receptor analysis revealed complete clonal overlap between HIV specific CD8+T cells in peripheral blood and lymph nodes. Transcriptional analysis of CD8+T cells in lymph nodes revealed gene features of inflammatory chemokines and antigen induced effector functions. In HIV controllers, cytotoxic effector molecules perforin and granzyme B are elevated in virus specific CXCR5+fCD8 near HIV RNA hotspots in follicles. These results are consistent with evidence that fCD8 controls lymphoid follicular infection through inflammation recruitment, antigen-specific proliferation, and cytotoxicity.
Experimental part
In this article, the author states that due to limited sample sources, it is not possible to obtain sufficient T cells from non controllers for direct transcriptomic comparison with HIV specific CD8+cells from controllers. To address this issue, the author adopted a more direct strategy: using single-cell resolution cell function assays to capture the functional relationships of cells in situ from tissues, in order to verify and infer that GC access and sustained cell lysis potential are key determinants of long-term viral control in LN, and will provide more information for triggering immune control against lymphocyte infections and cancer.
In the functional determination of in situ single-cell resolution, researchers used Tissue Cytometry technology as a support. The Tissue Cytometry technology provides an in situ integrated solution that not only provides realistic slice in situ imaging results (compared to some slide scanners that optimize scanning images through AI), but also accurately quantifies single cells in lymph nodes with extremely high cell density on top of the real imaging results. Combined with the distribution of perforin granzyme, CD8+cells, and virus particle expression, it is proposed that fCD8 maintains spontaneous control of infection through antigen driven proliferation and transient cytotoxicity of ongoing virus replication sites. Compared with transcriptomic analysis data alone, the article data combined with Tissue Cytometry technology is more accurate and detailed, and the validation conclusions are more reliable.
TissueFAXS is used for image acquisition of lymph node samples. (Cell nucleus (DAPI), HIV Gagpol RNA (white), CD8 (red), Perforin (yellow), and Granzyme B (blue))
StrataQuest software performs tissue region recognition and counting on images of lymph node tissue samples to determine whether each cell nucleus expresses HIV RNA and proteins such as CD8, perforin, and granzyme B.
StrataQuest software determines the range of lymph node follicular germinal centers based on cell morphology, CD8 distribution, and IgD positive B cells.
To evaluate the distance between cytotoxic and non cytotoxic fCD8 cells and the nearest HIV gagpol RNA positive cells, the x-y coordinates of HIV gagpol RNA positive cells, perforin+granzyme B+CD8+cells, and perforin CD8+cells were extracted from the image analysis report.

Fig 1 CD8+T cells with cytotoxicity in control lymph nodes during HIV replication process
(A) Multi color immunofluorescence (IF) and RNA Scope images of spontaneously controlled lymph nodes: HIV gagpol RNA (white), CD8 (red), perforin (yellow), and granzyme B (blue).
(B) Spearman correlation between the density of perforin/granzyme B cells co expressing CD8+cells and the cell density of HIV gagpolRNA in lymph node tissue slices.
(C) Based on morphological identification, determine the follicular germinal center (ROI) and divide it into orange lines according to the morphology of adjacent slices, relative CD8 exclusion (red), and IGD staining (green).
(D) Spearman correlation between perforin/granzyme B cells co expressing CD8+cells in follicular germinal centers and cells expressing HIV gagpolRNA.
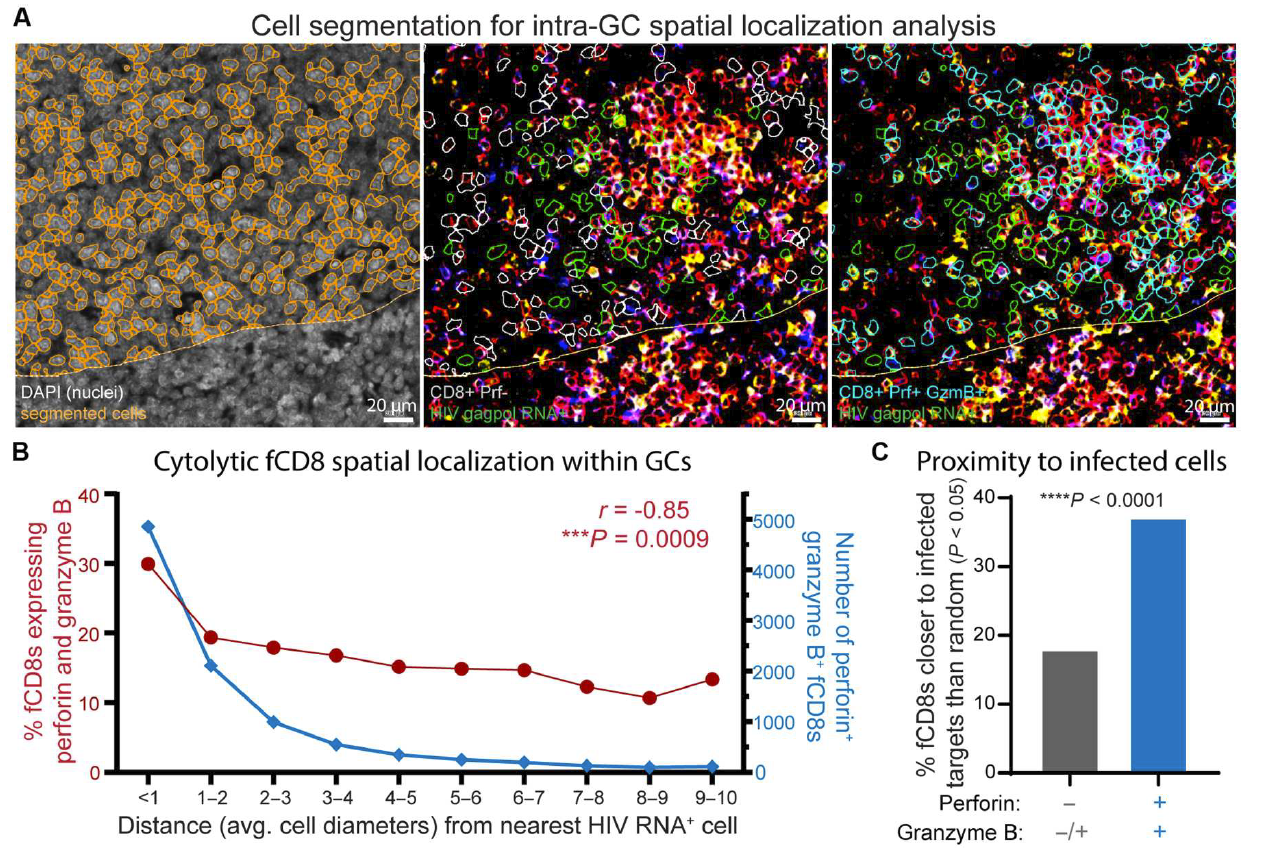
Fig 2 Cell lysis effector molecule of fCD8 in the proximal end of HIV infected cells in the germinal center
(A)Identify cell boundaries on multi-color immunofluorescence and RNA scope images through DAPI localization. Identify HIV gagpol RNA+cells (green), CD8+perforin cells (gray), or CD8+perforin+granzyme B+cells (blue) within the germinal center area.
(B)The number of fCD8 cells expressing perforin and granzyme B within a specified distance range from the nearest HIV gagpol RNA+cells (represented by an average cell diameter equivalent to 8.3 μ m increments) is expressed as the number of cells (right axis, blue) and the percentage of total fCD8 cells within each distance range (left axis, red, Spearman correlation).
